Chart Data
Overview
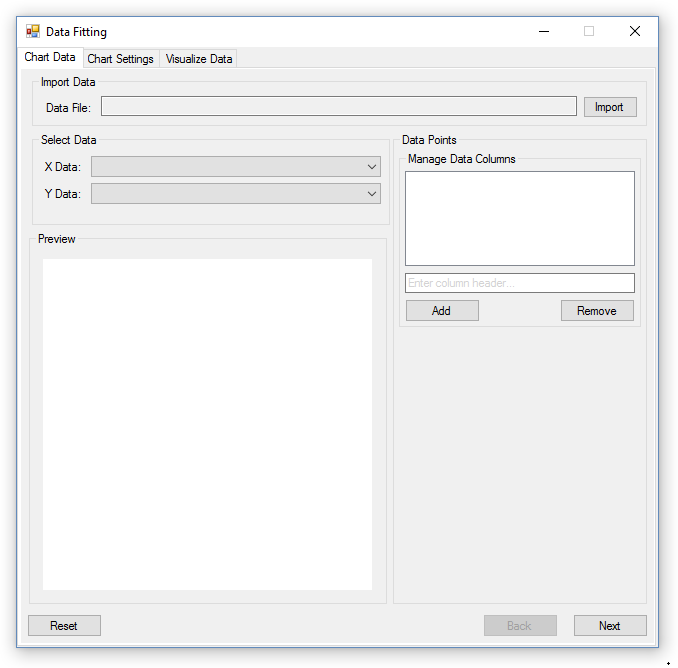
The chart data tab is where the user can manipulate the data that the program uses to generate charts and other information. The user has 2 options for inputting data, either through manual creation, or through importing data from a comma separated value file. Entered data can continuously be modified, and the preview chart will update in real time.
Data Entry
The user has 2 options for data entry, the first is by importing data from a .csv file, and the second, through manual entry. To import a file, the user should click the ‘import’ button, at the top of the window, and select the file they wish to import data from.
The format of the .csv file is important to understand before creating and importing data files. The data file consists of a collection of columns, each with a header value that labels it. The data underneath each header value is the data that column provides, and all columns must contain the same number of values. Below is an example of a properly formatted table as seen in a spreadsheet.
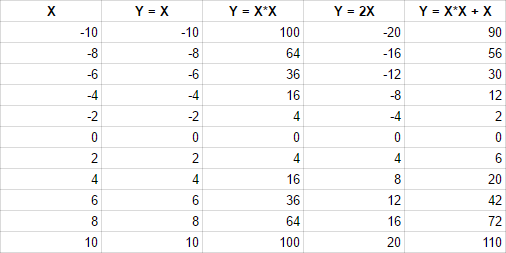
Note: Saving a spreadsheet containing a properly formatted table as a .csv file will create a file that can be read by the application.
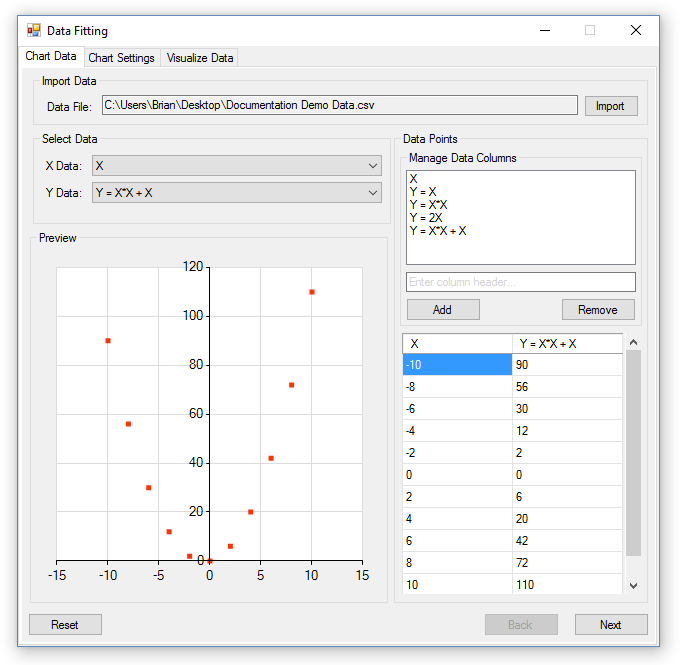
If the user imported a .csv file containing the above information, and the user selected the ‘Y=X*X + X’ column as the y data, it would appear like this in the application:
If the user decides to manually input data, they must first create a new column, or assign a column to a specific x or y data range. In order to create a new column, the user must first navigate to the ‘Manage Data Columns’ section, type the column name in, and press the ‘Add’ button. There is no limit to the amount of columns a user can add, the only requirement is that each column must have a unique name.
When a column has been assigned for both the x and y data ranges, the user will be able to modify the values contained in those columns. As the user edits column data, points the preview chart will update automatically to reflect those changes.
Selecting Data Ranges
In the application, data is stored as a collection of columns with unique names. In order to add data to a column, the user must assign that column to a specific range, either x or y. This is done by selecting the desired column from the combo boxes adjacent to the ‘X Data’ and ‘Y Data’ labels in the ‘Select Data’ section. When assigned, that column will replace the respective column in the data point editor, which can be noted by a change in column header.
Once both the x and y data ranges have been assigned a column, the user may modify the values shown in the editor. As the user adds or changes information, data points will automatically be created from valid x and y values, and will be shown in the preview chart.
Clearing Chart Data
To clear all data in the program, press the ‘Reset’ button on the bottom left portion of the window.
Warning! Since data is shared between all portions of the application, clearing data in this section will also clear it from all other sections.