Chart Settings
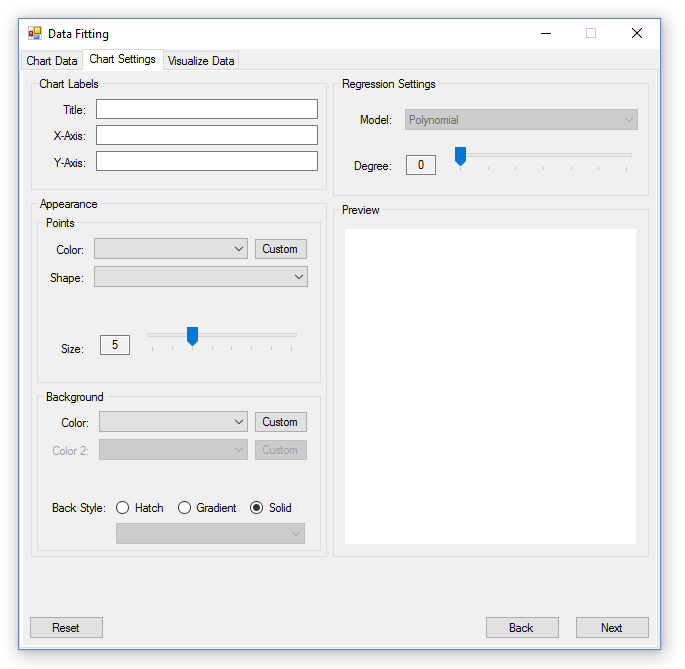
Overview
The Chart Settings tab is where the user can customize the appearance of their chart and create polynomial fits for their data. The user can add a title and axis labels, customize point and background appearances, and create polynomial trend lines for their data.
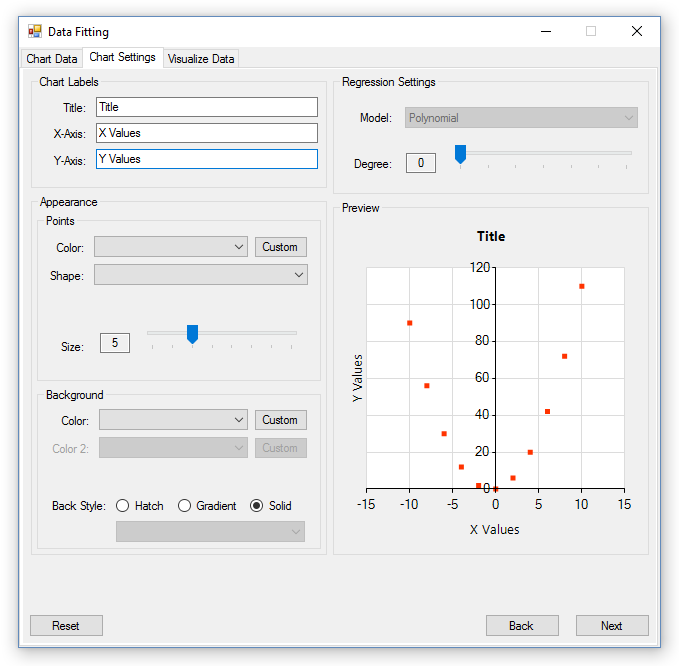
Chart Labels
To add a title to the x and y axis, and the chart, the user must navigate to the Chart Labels section and type in the names they wish for each in their respective textboxes. As the user types in information, the Chart Preview will update immediately to reflect those changes.
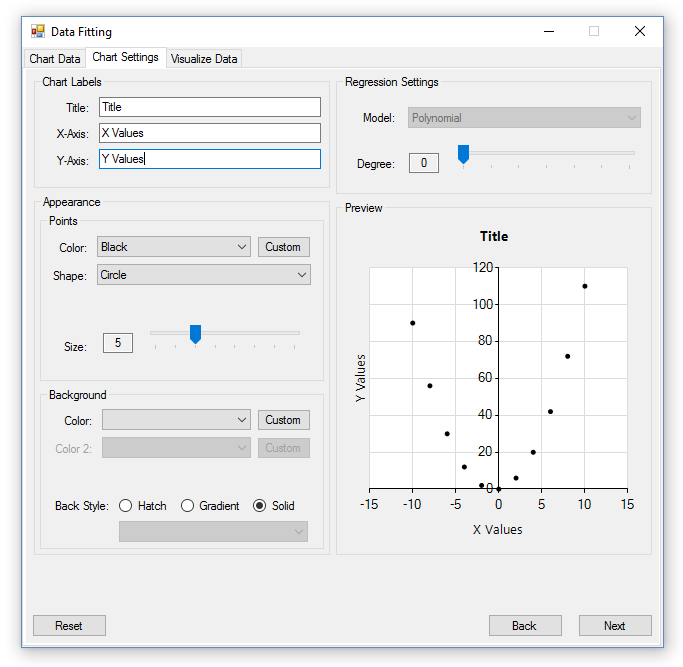
Point Appearance
The user has a variety of options for changing the appearance of points, which include the color, shape, and size of the point. To change the point color, the user has two options. They can select a color from a predefined list, or create a custom color by clicking the ‘custom’ button. Custom colors are saved for the life of the Data Fitting tool, and are shared with the custom colors found in the background appearance section on the same tab.
For a list of configuration options, see below:
- The point sizes the user can choose from range from sizes 3 - 10.
- For a list of preset colors the user can choose from, look here.
- A list of point shapes are here.
Below is an example of how points can be customized, and is shown in the chart preview.
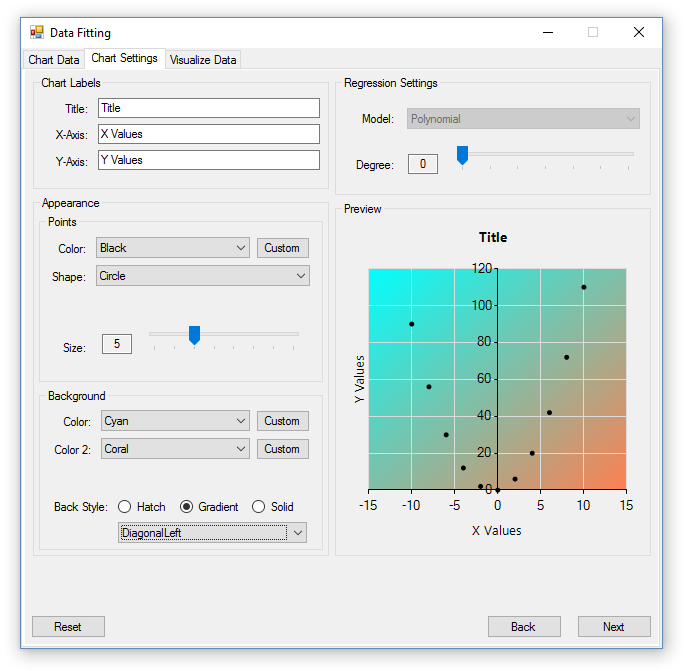
Background Appearance
The background appearance of the chart can be changed in many ways. The user can choose the style of the chart’s background, as well as the colors the style uses. The color options available to the user are the same as what’s available in the point customization, which include both predefined and custom colors.
For background styles, there are three options to choose from: solid color, gradient, and hatch. A solid color background uses the single color selection the user chose, and applies it to the entire plot area. A gradient requires two colors, and a gradient direction. The hatch style requires one color, and a hatch style selection. For the gradient and hatch background styles, the respective types will be populated into a combo box underneath the ‘Back Style’ radio buttons. This combo box becomes active when the ‘Solid’ option is not selected.
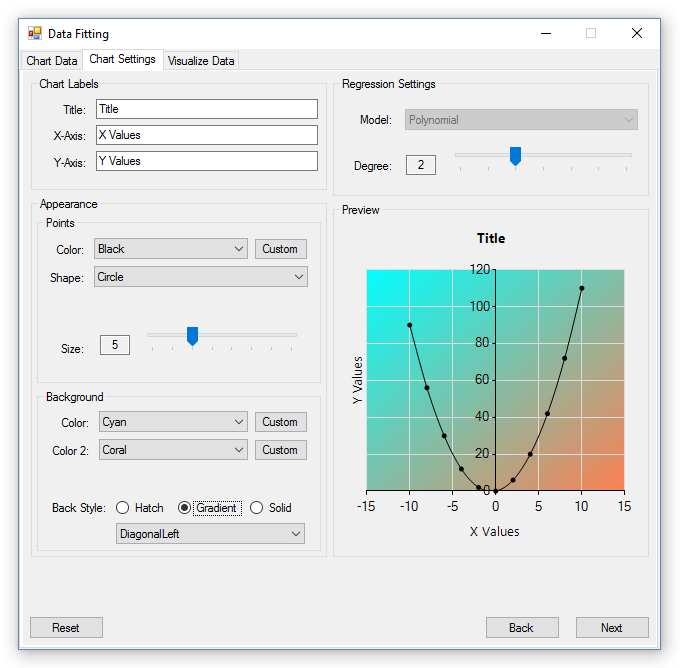
Here is an example of the gradient background style with coral and cyan colors selected.
Regression
The type of regression that’s currently in the application is polynomial regression. In order to perform regression on a set of data, move the slider in the regression section to change the degree of the resulting polynomial. As the degree changes, the curve will be plotted on the Preview Chart to show the user how well it fits the their data. For fit validation, various statistics and a residuals chart are provided in the next tab, titled ‘Data Visualization.’
Polynomials are fit through the least squares method, which is provided by the C# math library, Math.Net Numerics.
Resetting Chart Customization
To reset all customization and regression settings back to their defaults, press the ‘Reset’ button at the bottom left portion of the window.
Warning! This will reset all of the user’s selections, and can’t be reverted automatically. To get the user’s selections back, the user must manually select the customization and regression settings, they had previously, by manipulating the respective text boxes and sliders.